Clustering is an algorithmic way of finding 'groups' of similar data (i.e., clusters). While you might be able to put data onto a chart and look at it - clustering is a method whereby it's done computationally - which is better - if you've got a large number of data points (millions) and you want to group them into categories - you don't want to go doing it manually. Clustering to the rescue!
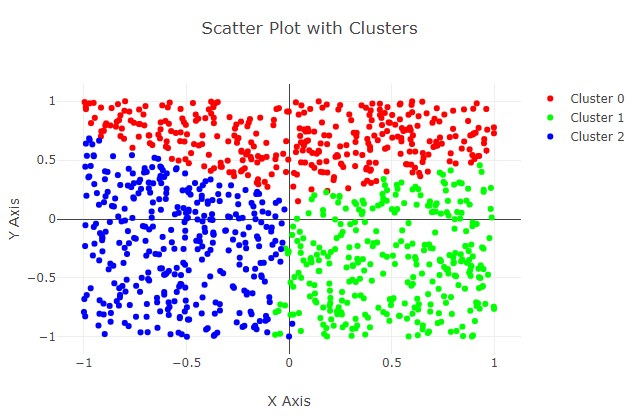
Output for the clustring algorithm example - simple k-mean.
Clusting is a hot topic in data mining and machine learnig - finding meaning in data.
The 'k-mean' algorithm is one of the simplest and easiest to implement - hence the once that is used here. As data can come in all sorts of forms and patterns - the k-mean usually does a simple 'distance' check - however, there are lots of other clustering algorithms that use other approaches (e.g., circular patterns or clusters with gaps or multiple paramaters).
For this example, after the compute shader has calculated the clusters (for a single iteration), we read back the cluster index values and plot them using a chart library (plotly). Each cluster index is a different color - so we can see that the algorithm is working (grouped together).
K-Mean Algorithm
Give a quick overview of how the k-mean clustering algorithm works - as it'll make the computer shader a little easier to understand.
For the k-mean we have to specify how many clusters we want the data split into (for this example, we say 3).
We also need a set of data - so for testing - we generate 1000 random ponits (x and y).
1. Initialization:
- Choose the number of clusters \( k \).
- Randomly initialize \( k \) cluster centers.
2. Assignment Step:
- Assign each data point to the nearest cluster center based on the Euclidean distance.
3. Update Step:
- Update each cluster center by computing the mean of all data points assigned to that cluster.
4. Repeat:
- Repeat steps 2 and 3 until convergence (i.e., when the cluster centers no longer change significantly or after a maximum number of iterations).
Compute Shader Code (Implementation)
Input is array of positions, output is the centre for each cluster and the index for each point into the cluster (i.e., which cluster each point belongs to).
// Define the number of data points and clusters
const NUM_POINTS   = ${NUM_POINTS};
const NUM_CLUSTERS = ${NUM_CLUSTERS};

struct ClusterCenters {
    centers: array<vec2<f32>, NUM_CLUSTERS>
};

@group(0) @binding(0) var<storage, read_write> pointsBuffer         : array< vec2<f32>, ${NUM_POINTS}>;
@group(0) @binding(1) var<storage, read_write> clusterCentersBuffer : array< vec2<f32>, ${NUM_CLUSTERS} >;
@group(0) @binding(2) var<storage, read_write> pointIndexBuffer     : array< u32, ${NUM_CLUSTERS} >;

@compute @workgroup_size(1, 1)
fn main(@builtin(global_invocation_id) globalId      : vec3<u32>,
        @builtin(local_invocation_id)  localId       : vec3<u32>,
        @builtin(workgroup_id)         workgroupId   : vec3<u32>,
        @builtin(num_workgroups)       workgroupSize : vec3<u32>
        )
{

    // Define local variables
    var clusterCenters: ClusterCenters;
    var pointClusterIndex: u32;

    // Initialize cluster centers
    for (var i = 0u; i < NUM_CLUSTERS; i = i + 1u) {
        clusterCenters.centers[i] = vec2<f32>(0.0, 0.0);
    }


    // Iterate over data points and assign them to the nearest cluster
    for (var i = 0u; i < NUM_POINTS; i = i + 1u) {
        var minDistance = 999999.0; // large value
        var nearestClusterIndex = 0u;

        // Calculate distance to each cluster center
        for (var j = 0u; j < NUM_CLUSTERS; j = j + 1u) {
            let distance = length(pointsBuffer[i] - clusterCenters.centers[j]);
            if (distance < minDistance) {
                minDistance = distance;
                nearestClusterIndex = j;
            }
        }

        // Assign data point to nearest cluster
        pointIndexBuffer[i] = nearestClusterIndex;
        clusterCenters.centers[nearestClusterIndex] = mix(clusterCenters.centers[nearestClusterIndex], pointsBuffer[i], 1.0 / f32(i + 1));
    }

    // Write cluster centers to the output buffer
    for (var i = 0u; i < NUM_CLUSTERS; i = i + 1u) {
        clusterCentersBuffer[i] = clusterCenters.centers[i];
    }
}
1. Initialization:
- The number of clusters (\( k \)) and data points are predefined constants.
- The cluster centers buffer (`clusterCentersBuffer`) is initialized with zeros.
2. Assignment Step:
- Iterate over each data point.
- For each data point, calculate the Euclidean distance to each cluster center.
- Assign the data point to the cluster with the nearest cluster center.
- Update the cluster centers buffer with the mean of all data points assigned to each cluster.
3. Update Step:
- There is no explicit update step in the shader. Instead, the cluster centers are updated dynamically during the assignment step.
4. Repeat:
- The shader code runs once, performing a single iteration of the assignment step and updating the cluster centers accordingly.
The compute shader has an array of positions for the points.
In the `main` function, the shader iterates over all data points and calculates the nearest cluster center for each point using a nested loop.
It updates the cluster centers buffer dynamically as points are assigned to clusters, computing the mean of all points assigned to each cluster.
Finally, it writes the updated cluster centers and point cluster indices to the output buffers.
This implementation performs a single iteration of the k-means algorithm in parallel on the GPU. To achieve convergence, you would typically run the shader multiple times or integrate it into a larger iterative algorithm until the cluster centers converge or a maximum number of iterations is reached.
Complete Code
We put it all together here into the complete program (WebGPU setup code as well). The whole program isn't overly long or complex - and seeing the compute shader and the WebGPU code together helps see any gaps in the functionality.
const NUM_POINTS = 1000;
const NUM_CLUSTERS = 3;


const wgslcompute = `
// Define the number of data points and clusters
const NUM_POINTS   = ${NUM_POINTS};
const NUM_CLUSTERS = ${NUM_CLUSTERS};

struct ClusterCenters {
    centers: array<vec2<f32>, NUM_CLUSTERS>
};

@group(0) @binding(0) var<storage, read_write> pointsBuffer         : array< vec2<f32>, ${NUM_POINTS}>;
@group(0) @binding(1) var<storage, read_write> clusterCentersBuffer : array< vec2<f32>, ${NUM_CLUSTERS} >;
@group(0) @binding(2) var<storage, read_write> pointIndexBuffer     : array< u32, ${NUM_CLUSTERS} >;

@compute @workgroup_size(1, 1)
fn main(@builtin(global_invocation_id) globalId      : vec3<u32>,
        @builtin(local_invocation_id)  localId       : vec3<u32>,
        @builtin(workgroup_id)         workgroupId   : vec3<u32>,
        @builtin(num_workgroups)       workgroupSize : vec3<u32>
        )
{

    // Define local variables
    var clusterCenters: ClusterCenters;
    var pointClusterIndex: u32;

    // Initialize cluster centers
    for (var i = 0u; i < NUM_CLUSTERS; i = i + 1u) {
        clusterCenters.centers[i] = vec2<f32>(0.0, 0.0);
    }


    // Iterate over data points and assign them to the nearest cluster
    for (var i = 0u; i < NUM_POINTS; i = i + 1u) {
        var minDistance = 999999.0; // large value
        var nearestClusterIndex = 0u;

        // Calculate distance to each cluster center
        for (var j = 0u; j < NUM_CLUSTERS; j = j + 1u) {
            let distance = length(pointsBuffer[i] - clusterCenters.centers[j]);
            if (distance < minDistance) {
                minDistance = distance;
                nearestClusterIndex = j;
            }
        }

        // Assign data point to nearest cluster
        pointIndexBuffer[i] = nearestClusterIndex;
        clusterCenters.centers[nearestClusterIndex] = mix(clusterCenters.centers[nearestClusterIndex], pointsBuffer[i], 1.0 / f32(i + 1));
    }

    // Write cluster centers to the output buffer
    for (var i = 0u; i < NUM_CLUSTERS; i = i + 1u) {
        clusterCentersBuffer[i] = clusterCenters.centers[i];
    }
}
`;

// Initialize WebGPU
const adapter = await navigator.gpu.requestAdapter();
const device = await adapter.requestDevice();


// Create buffers for data points and cluster centers
const pointsBuffer = device.createBuffer({
    size: NUM_POINTS * 8, // 2 floats per point
    usage: GPUBufferUsage.STORAGE | GPUBufferUsage.COPY_SRC | GPUBufferUsage.COPY_DST
});

const clusterCentersBuffer = device.createBuffer({
    size: NUM_CLUSTERS * 8, // 2 floats per center
    usage: GPUBufferUsage.STORAGE | GPUBufferUsage.COPY_SRC | GPUBufferUsage.COPY_DST
});

const pointClusterIndexes = device.createBuffer({
    size: NUM_POINTS * 4, // u32 index for each point - which cluster it belongs (index into cluster) 0 - NUM_CLUSTERS-1
    usage: GPUBufferUsage.STORAGE | GPUBufferUsage.COPY_SRC | GPUBufferUsage.COPY_DST
});

// Generate random data points
const pointsData = [];
const pointIndexes = [];
for (let i = 0; i < NUM_POINTS; i++) {
    pointsData.push(Math.random() * 2 - 1, Math.random() * 2 - 1);
    pointIndexes.push(-1); // initialize to invalid value
}

// Copy data points to the GPU buffer
const pointsArrayBuffer = new Float32Array(pointsData);
device.queue.writeBuffer(pointsBuffer, 0, pointsArrayBuffer);

const pointIndexesBuf = new Float32Array(pointIndexes);
device.queue.writeBuffer(pointClusterIndexes, 0, pointIndexesBuf);

const bindGroupLayout = device.createBindGroupLayout({
  entries: [ {binding: 0, visibility: GPUShaderStage.COMPUTE, buffer: {type: "storage"}  },
             {binding: 1, visibility: GPUShaderStage.COMPUTE, buffer: {type: "storage"}  },
             {binding: 2, visibility: GPUShaderStage.COMPUTE, buffer: {type: "storage"}  },
           ]
});

const bindGroup = device.createBindGroup({
  entries: [
    { binding: 0, resource: { buffer: pointsBuffer         }  },
    { binding: 1, resource: { buffer: clusterCentersBuffer }  },
    { binding: 2, resource: { buffer: pointClusterIndexes  }  }
  ],
  layout: bindGroupLayout
});


const computeShaderModule = device.createShaderModule({
  code: wgslcompute,
});

const computePipe = device.createComputePipeline({
  layout :   device.createPipelineLayout({bindGroupLayouts: [bindGroupLayout]}),
  compute: { module    : computeShaderModule,
            entryPoint: "main" }
});


// Execute the compute shader
const commandEncoder = device.createCommandEncoder();
const passEncoder = commandEncoder.beginComputePass();
passEncoder.setPipeline(computePipe);
passEncoder.setBindGroup(0, bindGroup );
passEncoder.dispatchWorkgroups(1);
await passEncoder.end();

const gpuCommands = commandEncoder.finish();
await device.queue.submit([gpuCommands]);

// Read back cluster centers from the GPU buffer

// -------------------------------------
// Getting the data back from the gpu buffers

// Note this buffer is not linked to the 'STORAAGE' compute (used to bring the data back to the CPU)
const bufferTmp = new Float32Array( pointIndexesBuf.length );
const gbufferTmp = device.createBuffer({ size:  pointIndexesBuf.byteLength, usage: GPUBufferUsage.COPY_DST | GPUBufferUsage.MAP_READ});
//device.queue.writeBuffer(gbuffer3, 0, buffer3);

const commandEncoder2 = device.createCommandEncoder();
// Encode commands for copying buffer to buffer.
commandEncoder2.copyBufferToBuffer(
    pointClusterIndexes, // source buffer
    0,                  // source offset
    gbufferTmp,           // destination buffer
    0,                  // destination offset
    bufferTmp.byteLength  // size
);

// Submit GPU commands.
const gpuCommands2 = commandEncoder2.finish();
await device.queue.submit([gpuCommands2]);


// Map and read buffer
await gbufferTmp.mapAsync(GPUMapMode.READ);
const arrayBuffer0 = gbufferTmp.getMappedRange();
const dataTmp = new Uint32Array(arrayBuffer0);
const buf0 = Array.from(dataTmp);
console.log('arrayBuffer0 :', dataTmp[0] );
// Clean up
gbufferTmp.unmap();

//for (let i=0; i<100; i++)
console.log("Value after computation:", buf0[0]);

// ---------------------------------
// Visualization code - scatter chart

const clusters = [];
for (let i = 0; i < NUM_POINTS; i++) {
    const x = pointsData[i * 2];
    const y = pointsData[i * 2 + 1];
    const clusterIndex = buf0[ i ]; // The cluster index is stored after the data points
    clusters.push({ x, y, clusterIndex });
}


let promise      = await fetch('https://cdn.plot.ly/plotly-latest.min.js');
let text         = await promise.text();
let script       = document.createElement('script');
script.type      = 'text/javascript';
script.async     = false;
script.innerHTML = text;
document.body.appendChild(script);


let div = document.createElement('div');
document.body.appendChild( div );
div.id = 'scatter-plot';


// Get unique cluster indices and assign colors
const uniqueClusterIndices = [...new Set(clusters.map(cluster => cluster.clusterIndex))];
const colors = uniqueClusterIndices.map((index, i) => `hsl(${i * 360 / uniqueClusterIndices.length}, 100%, 50%)`);

// Create traces for each cluster
const traces = uniqueClusterIndices.map((clusterIndex, index) => {
  const clusterPoints = clusters.filter(cluster => cluster.clusterIndex === clusterIndex);
  return {
    x: clusterPoints.map(point => point.x),
    y: clusterPoints.map(point => point.y),
    mode: 'markers',
    type: 'scatter',
    name: `Cluster ${clusterIndex}`,
    marker: { color: colors[index] }
  };
});

// Plot the data
Plotly.newPlot('scatter-plot', traces, {
  title: 'Scatter Plot with Clusters',
  xaxis: { title: 'X Axis' },
  yaxis: { title: 'Y Axis' }
});
Things to Try
• Try other numbers of clusters (e.g., 4, 5, 6, ..)
• Try generating other data patterns (instead of just random noise - or loading in a set of data to see what clusters the algorithm finds)
• Draw the centroid for each of the clusters on the chart
• Run the k-mean clustering algorithm multiple iterations (instead of just once)
• Try optimizing the implementation better so it calculations are distributed across the GPU threads better