The famous words, "If you can't measure it, you can't improve it" by Lord Kelvin - so with any graphics system - we need to know what our frame rate is! Not only to ensure that we're running fast - but also for our calculations and updates (animations and simulations will use a delta timing factor instead of a hard coded constant).
Keeping track of the time! At the moment it's a simple HUD to provide some feedback - later we'll elaborate on this to put state information, number of tris getting drawn etc.
Of course, Javascript has done all the hard work for us by providing the function
performance.now()
which we can use to determine how much time has elapsed between function calls.
var startTime = performance.now()

let k = 0.001;
for (let i=0; i<10000; i++)
{
    for (let i=0; i<10000; i++)
    {
        k = k * 2.02 + 0.01;
    }
}

var endTime = performance.now()

console.log('time taken:', endTime  - startTime, ' milliseconds');
I'm not sure if my computer is slow - as that calculation took just under 200 miliseconds for me!! This is the console output I got:
["time taken:",196.79999995231628,"milliseconds"]
All modern browsers have JavaScript profilers built-in. These profilers should give the most accurate measurement as you do not have to modify your existing code, which could affect the function's execution time.
However, we're not just interested in profiling information - we also want reasonably accurate timing information so we can make updates to the animations late on (also so we can display stats on screen for the user - not via the debug console).
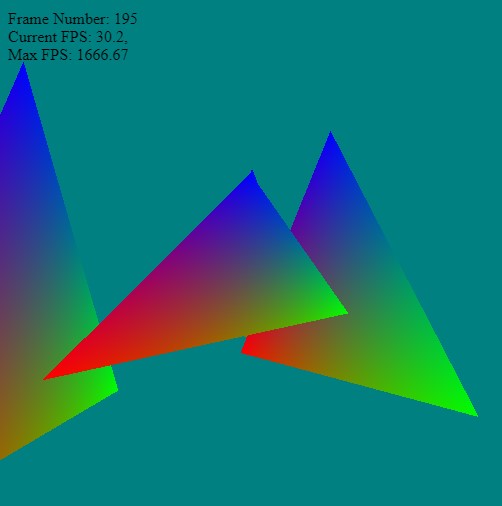
HUD Display
So we can put the FPS info on screen, let's just overlay a simple div on top of the canvas (a quick and simple HUD or head-up display). Later on when we get into textures and more complex topics - we can render text and information to a texture and embed it in the scene. But for now, to keep things simple, let's just record the timing information for the render loop and put it in the top left corner.
• FPS - update speed - how fast the browser is calling our frame loop
• Cost - how many milliseconds it takes render our scene (and theoretical maximum FPS)
• Frame Count (integer displaying how many frames have elapsed)
We can add the simple `div` tag for the timing information as follows:
We set its position to absolute so it's out of the browser flow control - and can be position in the top left overlapping the canvas area.
The following shows the update loop for the render - there is also a `debug slowdown` commented out - just to check if the performance numbers are correct. Typically the browser will limit the refresh update using
requestAnimationFrame(..)
to about 30ish frames per second - however, by measuring the time it takes from the start to finish of the render we can approximate the maximum FPS (theoretically).
If the FPS drops below 30 FPS both the MAX and current FPS should be the same.
<?php
let counter = 0.0;
let frameNumber = 0;
var fpsTime = performance.now();
function frame()
{
var startTime = performance.now();
// setup a transform for each triangle
let tris = [ { p:{x:0,y:0,z:0}, r:{x:0,y:0.0,z:0.0}, s:{x:1.0, y:1.0,z:1.0} },
{ p:{x:1,y:0,z:0}, r:{x:0,y:0.2,z:0.0}, s:{x:1.0, y:1.1,z:1.0} },
{ p:{x:0,y:0,z:2}, r:{x:0,y:2.0,z:0.0}, s:{x:0.7, y:1.2,z:1.0} },
{ p:{x:1,y:0,z:1}, r:{x:0,y:1.4,z:0.0}, s:{x:1.0, y:0.5,z:0.5} } ];
/*
Debug if you want to add a slowdown to the main update loop - drop from 2000 fps max to about 20 fps
let gg = 0.0;
for (let kk=0; kk<1000; kk++)
for (let bb=0; bb<1000; bb++)
{
gg = gg*0.2 + 0.42 + kk;
}
*/
// loop over each triangle and render it
tris.forEach( (t,k)=>{
let modelMatrix = buildMatrix(t.p, t.r, t.s);
// update the local matrix for each triangle draw differently
device.queue.writeBuffer(mvpUniformBuffer, 0, modelMatrix);
// Rotate the camera around the origin in the circle
let cameraEye = [ Math.cos(counter)*3.0, 0.0, Math.sin(counter)*3.0 ];
mat4.lookAt(viewMatrix, cameraEye, [0,0,0], [0, 1, 0]);
device.queue.writeBuffer(mvpUniformBuffer, 64, viewMatrix);
// simple counter
counter += 0.001;
const renderPassDescription = {
colorAttachments: [{
view: context.getCurrentTexture().createView(),
loadOp: (k==0 ? "clear":"load"),
clearValue: [0, 0.5, 0.5, 1], // clear screen to color
storeOp: 'store'
}],
depthStencilAttachment: {
view: depthTexture.createView(),
depthLoadOp: (k==0 ? "clear":"load"),
depthClearValue: 1,
depthStoreOp: "store",
}
};
renderPassDescription.colorAttachments[0].view = context.getCurrentTexture().createView();
const commandEncoder = device.createCommandEncoder();
const renderPass = commandEncoder.beginRenderPass(renderPassDescription);
renderPass.setBindGroup(0, uniformBindGroup);
renderPass.setPipeline(pipeline);
renderPass.setVertexBuffer(0, positionBuffer);
renderPass.setVertexBuffer(1, colorBuffer);
renderPass.setIndexBuffer(indexBuffer, 'uint16');
renderPass.drawIndexed(3,1);
renderPass.end();
device.queue.submit([commandEncoder.finish()]);
});
// animate - keep updating
requestAnimationFrame(frame);
// --------- Timing Information -------------------------
frameNumber++;
var endTime = performance.now();
var updateFPS = 1000.0 / ( endTime - fpsTime);
var maxFPS = 1000.0 / ( endTime - startTime);
fpsTime = endTime;
divInfo.innerHTML = `
Frame Number: ${frameNumber}<br>
Current FPS: ${updateFPS.toFixed(1)},<br>
Max FPS: ${maxFPS.toFixed(2)}`;
}